Indicators User Interface
Learn how to use the indicators Graphical User Interface, in order to show them in charts and watch their values in tabular form.
The graphical controls are described.
The indicator tree with its branches, the description pane and its information about indicators, the selection panes where to select
the indicators to plot in charts or show in tables, how to insert the input parameters for indicators, how to import an indicator from a file.
Also, innovative implementations in Trading Conceiver are offered: different prices to use for indicators' calculation,
different kinds of Moving Averages to use to smooth indicators and options for angles.
Select the Indicators tab
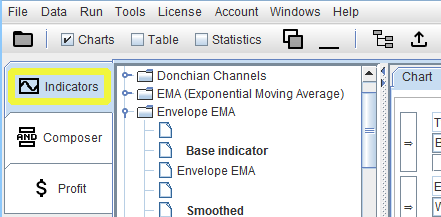
In the main window of Trading Conceiver, select the main tab
Indicators
Sections
Here are the main sections of the Indicators user interface: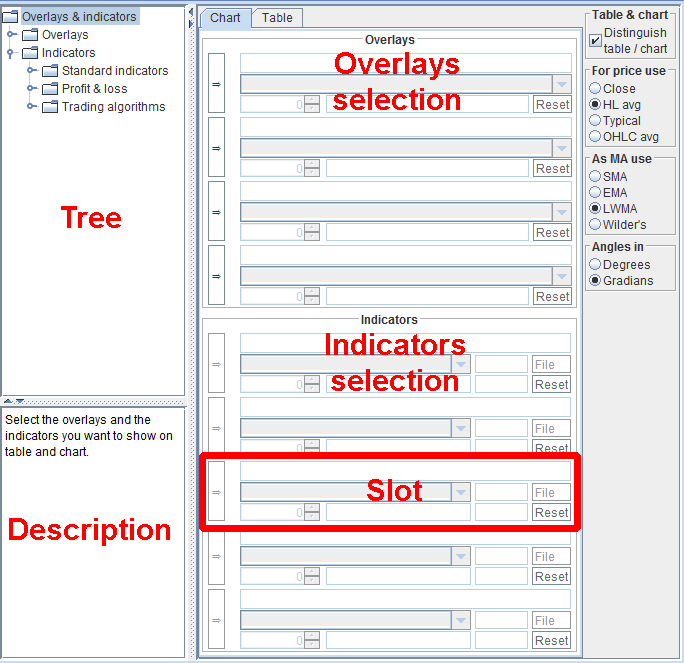
The Indicators Tree
 The list of implemented overlays and indicators is presented in a tree-like structure.
To expand or collapse a branch, either double click on it or click on its handle.
The list of implemented overlays and indicators is presented in a tree-like structure.
To expand or collapse a branch, either double click on it or click on its handle.
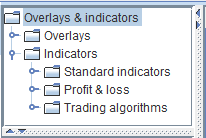
Overlays and Indicators Branches
The tree has two main branches:- Overlays
They are charted in the same graph as the price. - Indicators
They are charted in a graph separate from the price.
The Indicators Sub-Branches
TheIndicators branch is further divided into three branches:
- Standard indicators
Contains standard indicators, in the usual sense. - Profit & loss
These are devised for plotting profit and loss quantities in charts. - Trading algorithms
These are representations of trading algorithms, again useful for plotting in charts.
Select an indicator
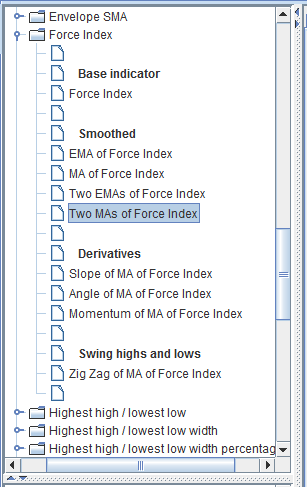 By expanding the branches, at the end the leaves are found, where the actual indicators lie.
To select an indicator, click on it.
Some leaves are left empty, for readability purposes.
Other leaves contain titles, in bold characters, again for improved readability.
By expanding the branches, at the end the leaves are found, where the actual indicators lie.
To select an indicator, click on it.
Some leaves are left empty, for readability purposes.
Other leaves contain titles, in bold characters, again for improved readability.
Collapse the Whole Tree
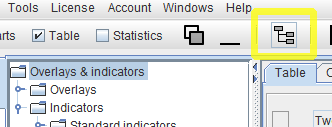 After a while you could find to have expanded a lot of branches and want to collapse the whole tree.
In order to do that, click on the tree icon in the main tool-bar.
After a while you could find to have expanded a lot of branches and want to collapse the whole tree.
In order to do that, click on the tree icon in the main tool-bar.
Resize the Tree Pane
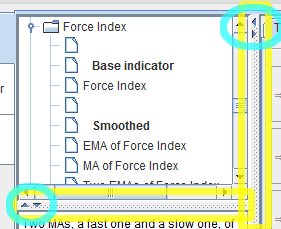 You can resize the tree pane, vertically or horizontally, by dragging the dividers on its sides.
You can even collapse the whole pane containing the tree, vertically or horizontally, by clicking on the small arrows of the dividers;
to expand it, click on the arrows again.
You can resize the tree pane, vertically or horizontally, by dragging the dividers on its sides.
You can even collapse the whole pane containing the tree, vertically or horizontally, by clicking on the small arrows of the dividers;
to expand it, click on the arrows again.
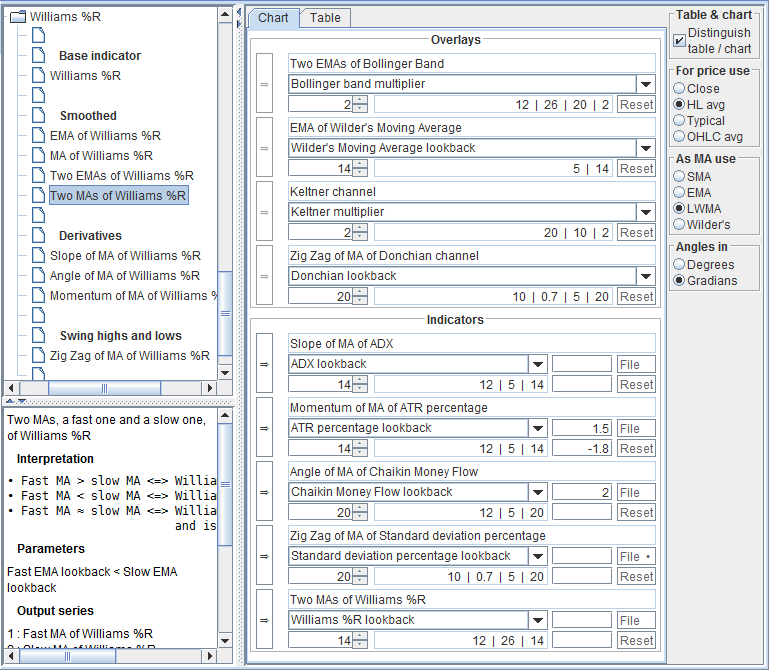
The Description Pane
Introduction / Definition
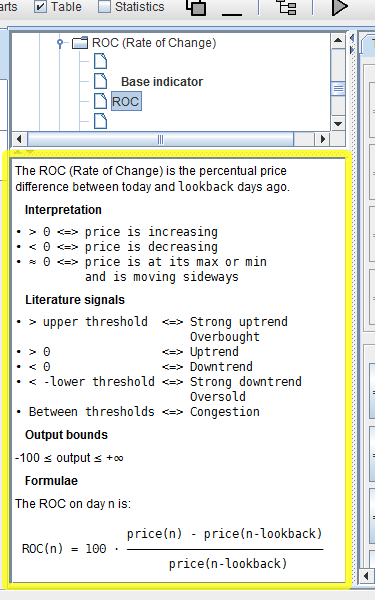
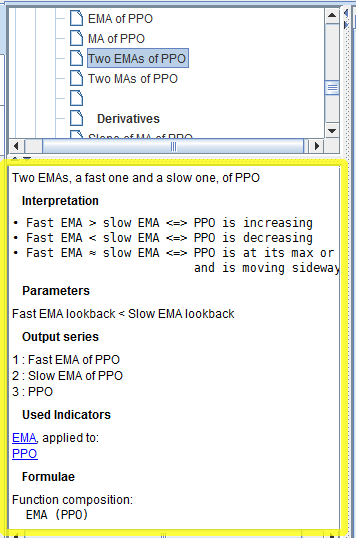
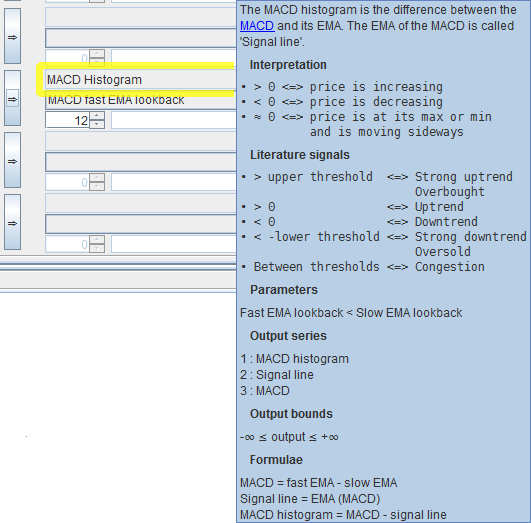
A brief introduction or definition comes first.Interpretation
Here you can find how to interpret the indicator, according to the literature. We stress that these are just notes about what you can find in the literature. Do not stick to it! The real interpretation is up to you. Oftentimes the interpretation depends on the value taken on by the indicator. Considerations in the different ranges of the indicator's output are usually reported.Literature Signals
This is what literature usually says about the phase of the market implied by the indicator, like uptrend, downtrend or congestion. Do NOT rely on the signals listed here! Decisions are up to you! These are only notes / remainders of what you can find in bibliography. Any decision is legitimate, even the exact opposite of what is reported by reputable authors. Moreover, a single indicator seldom can give reliable signals; these must always be confirmed by other indicators.Parameters
Most indicators require input parameters from the user. If the meaning or range of such parameters is not readily clear from the description or from the formulae, some elucidation could be reported in this section. Usually, it is not reported for the lookback period, because it is trivial.Output Series
The output of some indicators consists of more than one curve, or series of values. In those cases, usually the list of series is reported here. When it is obvious what the output series are, even if multiple, nothing is reported here; e.g. in channels / bands indicators.In Tables and Charts
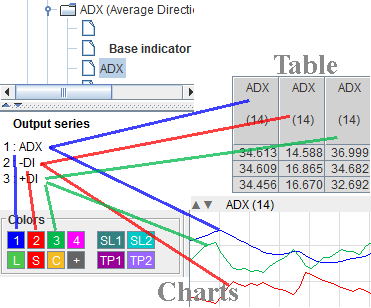 The ordinal number of the series is also meaningful, e.g. because it determines the color in the Charts or the relative position in the Table.
In Charts look at the color correspondent to the series in order to pinpoint the curve of interest.
In the Table look at the relative position of the series in order to identify the column of interest.
For instance, in the picture the ADX indicator has three output series. The
-DI output series, as reported in the description pane, is the number 2.
In Charts it is drawn with the color number 2.
In the table it is shown in the second of the three columns dedicated to the ADX indicator.
Output Bounds
Here the output bounds are described. They might be useful when deciding a threshold in many trading algorithms, as reported in the Interpretation and Signals sections. Note that the bounds of the base indicator reported here, refer to the fact that the input data for the base indicator is the price, which is always a positive number. But the bounds of the function, per se, could be different. For instance, the Rate of Change (ROC) per se is unbound but, when applied to a positive quantity, its lower bound is -100.Used Indicators
Some indicators depend on others. For instance, all variants of a base indicator do. In that case those indicators are pointed out here, in form of links. Click the link to go to the description of the relevant indicator.Hint / Note
Here some notes might be reported.Formulae
The mathematical formula defining the indicator is written here. This is the real definition of the indicator. It also disambiguates cases where slightly different variations of the same indicator appear in literature.The Selection Panes
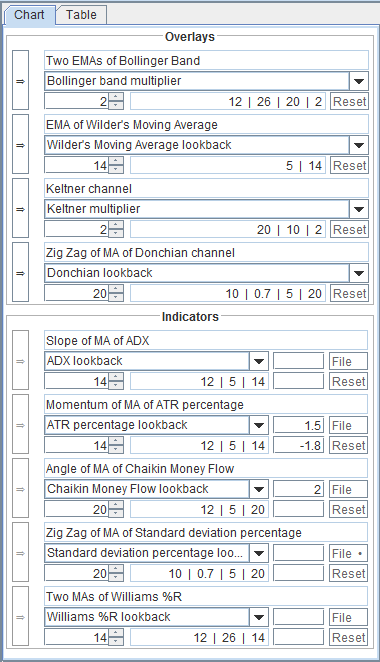 The selection panes are where you select the indicators you want to plot in charts or show in the table.
Two tabs
Indeed, there are two of them:- Chart
The indicators selected here will be plotted in the charts. - Table
The indicators selected here will be shown in the table.
Distinguish Table / Chart
 Usually you want to plot on chart and show in the table the same indicators.
In that case, you can deselect the check-box
Usually you want to plot on chart and show in the table the same indicators.
In that case, you can deselect the check-box
Distinguish table / chartand fill in just one tab with the indicators of your choice. They will be used both for the table and the charts. On the contrary, by selecting the check-box, you can distinguish the two.
Overlays and Indicators Sections
Each tab is divided into two sections:- Overlays
Charted in the same graph as the price. - Indicators
Each of them is charted in a graph separate from the price.
The Slots
 Each slot consists of the following.
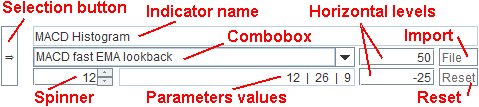
The Selection Buttons
When you press the selection button, the correspondent slot is filled in with the indicator selected in the tree. This way the indicator is effectively selected. The buttons in theOverlays or Indicators sections are enabled only when the correspondent branch
in the Indicators Tree is selected. So if any of the leaves or sub-branches of the Overlays branch is selected in the Indicators Tree,
just the selection buttons for the Overlays section are enabled in the selection pane, while the selection buttons of the Indicators section are disabled.
The other way around holds if the selection in the Indicators Tree involves the Indicators branch.
So, first select the overlay or indicator of your choice in the tree, then press one of the selection buttons to put it in the corresponding slot.
Indicator Name
 The indicator name is shown on top. If you hover the mouse over it, the description of the indicator is shown as a tooltip.
Combobox
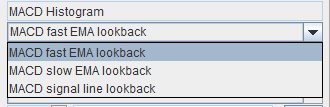 Input parameters are given default values just for convenience. Do not rely on those. Choose your own.
To choose the value for an input parameter, first select it through the combobox.
Input parameters are given default values just for convenience. Do not rely on those. Choose your own.
To choose the value for an input parameter, first select it through the combobox.
Spinner
After selecting the input parameter in the combobox, you can choose its value thorough the spinner. You can input the new value manually, and then pressing the 'Enter' key. Or you can increment / decrement the value by pressing the up / down arrows, respectively. If the number is an integer, the increment is by 1. If the number is a floating-point number, the increment is by 0.1. The spinner makes sure some constraints are satisfied, like the lower and upper bounds for each parameter. Usually you can find such bounds in theParameters section of the description.
You cannot input values colliding with the constraints.
Input Parameters Values
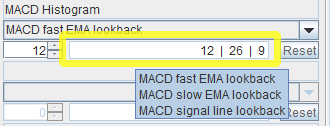 In this text-field you can see all the input parameters.
If you hover the mouse over this field, a tooltip with the names of the input parameters appears.
The order is the same as in the combobox.
In this text-field you can see all the input parameters.
If you hover the mouse over this field, a tooltip with the names of the input parameters appears.
The order is the same as in the combobox.
Horizontal Levels
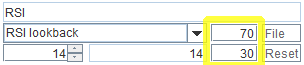 These two text-fields are present only in the Indicators sub-section of the Chart tab.
You can optionally have two horizontal levels to be plotted in the chart of each indicator.
Just enter the levels here.
This is useful for instance if you want to highlight levels above or below which to take certain actions.
As an example, the RSI is thought to signal overbought conditions when greater than 70 and oversold conditions when less than 30.
So you can can put the RSI indicator in one of the slots and input the values 70 and 30 in the correspondent horizontal levels text-fields.
These two text-fields are present only in the Indicators sub-section of the Chart tab.
You can optionally have two horizontal levels to be plotted in the chart of each indicator.
Just enter the levels here.
This is useful for instance if you want to highlight levels above or below which to take certain actions.
As an example, the RSI is thought to signal overbought conditions when greater than 70 and oversold conditions when less than 30.
So you can can put the RSI indicator in one of the slots and input the values 70 and 30 in the correspondent horizontal levels text-fields.
Import File Button
 The import File button is present only in the Indicators sub-section of the Chart tab.
By pressing this button, you can import an indicator output from a file.
The imported indicator will be plotted together with the indicator selected in the slot.
The import File button is present only in the Indicators sub-section of the Chart tab.
By pressing this button, you can import an indicator output from a file.
The imported indicator will be plotted together with the indicator selected in the slot.
No Automatic Re-Import
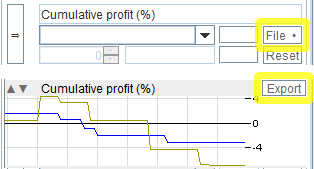
If the imported file is changed on disk after the import operation, the import is not performed again automatically; you must do it by pressing the File button again.Export
The indicator to be imported must have been previously exported, in the Chart window.Graphics
To signal that a file has been imported, a dot is added to the name of the button:File •Moreover, the imported file name appears as a tooltip for the File button.
Usage
This feature is intended to be used to compare different simulations with the same historical file. For instance, it is particularly useful to compare two trading systems by plotting their cumulative profit together, in the same graph. To do that as an example:- Compose your trading system.
- Put the "Cumulative profit (%)" indicator, of the "Profit & loss" branch, in one slot.
- Run the simulation.
- In the Charts window, export the indicator in a file.
- Make changes to your trading system.
- In the slot where the "Cumulative profit (%)" indicator lies, press the File button.
- Select the previously exported file.
- Run the simulation again.
Constraints
As said, this feature is intended to be used for simulations made with the same historical file. An error is issued if the number of entries in the file to import doesn't match the one of the current historical file.Asymmetry
The import and export operations are performed in different windows. Although this might appear as counter intuitive, it is purposely designed for clearness and easy of use. The export operation is executed in the Chart window, so that it is clear what is being exported, in particular to what simulation run the curve refers to. The import operation is finalized in the Indicators tab of the main window, so that you can select the file just once and run multiple simulations.Reset Button
Press theReset button to clear the slot.
For Price Use Radio Buttons
 In literature, indicators are always defined using closing prices.
For instance, the formula for the Simple Moving Average (SMA) with a lookback period of 3 is:
In literature, indicators are always defined using closing prices.
For instance, the formula for the Simple Moving Average (SMA) with a lookback period of 3 is:
         close(1) + close(2) + close(3)
  SMA = ────────────────────────────────    [1]
                       3
The close price is used because it is considered to be the most important, as it is the very last price of the trading session, hence the most recent one.
Different averages
However, exactly the same formula [1] can be applied with other price values instead of the closing ones.HL average
For instance, we can consider the average between the high and low, or high-low average, defined as:
                high + low
  HL average = ────────────
                    2
Substituting the close price with this average, formula [1] becomes:
         HL avg(1) + HL avg(2) + HL avg(3)
  SMA = ───────────────────────────────────
                       3
With this choice we are considering the whole range of the price, between high and low, to be most important, not the closing price.
Typical Price
Another possible average is the typical price, that is the average between the high, low and close values:
                   high + low + close
  Typical Price = ────────────────────
                           3
This kind of average considers equally important the high, low and close values.
Put another way, it considers important the whole range of the price, between the low and the high, as before the HL average,
but factors in also the close, to shift the average more toward the close.
OHLC Average
Still another possibility is the OHLC Average, i.e. the average between the open, high, low and close values
                  open + high + low + close
  OHLC Average = ───────────────────────────
                              4
This average considers of equal importance the open, high, low and close values.
In Trading Conceiver
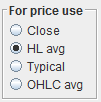
In the 'For price use' pane, Trading Conceiver lets you select between all the previously mentioned quantities:
- Close
- HL average
- Typical price
- OHLC average
As MA use Radio Buttons
 In the indicators derived from the base one, a crucial role is played by the Moving Average, abbreviated as
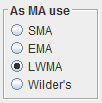
 MA. E.g.
MA of StochasticTrading Conceiver lets you select between the following moving averages:
- SMA (Simple Moving Average)
- EMA (Exponential Moving Average)
- LWMA (Linear Weighted Moving Average)
- Wilder's Moving Average
Link
The link in the 'Used Indicators' section of the description pane, will always bring you to the indicator, according to the selection in theAs MA use pane.
Formulae
Given the sequence of values x(i), the following formulae hold for the average atn.
SMA
            x(n-lookback+1) + ... + x(n)
  SMA(n) = ──────────────────────────────
                     lookback
EMA
  EMA(n) = EMA(n-1) + (x(n) - EMA(n-1)) · smoothing factor
where:
                           2
  smoothing factor = ──────────────
                      lookback + 1
LWMA
             x(n-lookback+1)·1 + ... + x(n)·lookback
  LWMA(n) = ─────────────────────────────────────────
               1 + ... + (lookback-1) + lookback
Wilder's Moving Average
  Wilder(n) = Wilder(n-1) + (x(n) - Wilder(n-1)) · smoothing factor
where:
                        1
  smoothing factor = ────────
                     lookback
Angles in Radio Buttons
 One of the indicators derived from the base one is the
 Angle.
As its name implies, it is the angle formed by two points on the curve.
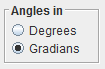
Angles can be expressed in many units of measure.
Trading Conceiver lets you select how to express angles between degrees and gradians.
There are 90 degrees and 100 gradians in the right angle. Some examples:
-90° = -π/2 radians = -100 gradians
-45° = -π/4 radians = -50 gradians
0° = 0 radians = 0 gradians
+45° = +π/4 radians = +50 gradians
+90° = +π/2 radians = +100 gradians 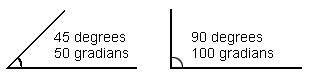 This selection holds for any angle, in particular for input parameters.
So if an input parameter of an algorithm is an angle, the maximum and the minimum value you can input depend on the choice made here,
namely ±90 for degrees or ±100 for gradians.
This selection holds for any angle, in particular for input parameters.
So if an input parameter of an algorithm is an angle, the maximum and the minimum value you can input depend on the choice made here,
namely ±90 for degrees or ±100 for gradians.
Save and Load the Configuration
You can save and load the configuration both for the Indicators and Composer panels, together. This is described in the Composer User Interface.Reset the Tabs
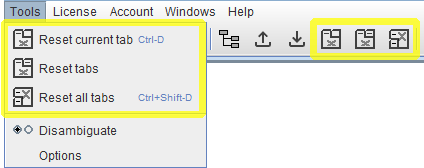
Reset Current Tab
To reset only the current tab (Chart, Table) select the menuTools → Reset current tabor click the homonymous icon in the main tool bar.
Reset Tabs
To reset all the tabs in the Indicators pane (Chart, Table) select the menuTools → Reset tabsor click the homonymous icon in the main tool bar.
Reset All Tabs
To reset all the tabs both in the Indicators pane (Chart, Table) and in the Composer pane (Long, Short, Liquidate long, Liquidate short, Stop loss, Take profit) select the menuTools → Reset all tabsor click the homonymous icon in the main tool bar.