Charts
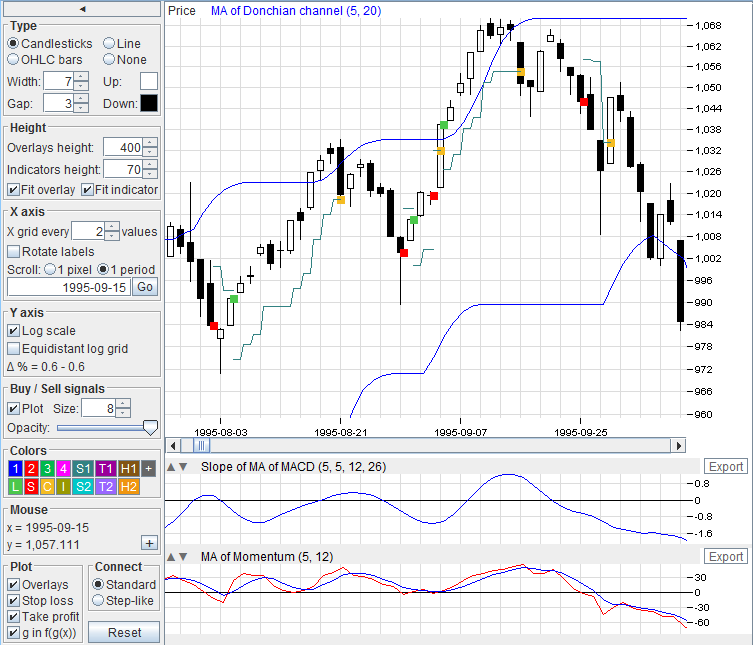
Trading Conceiver outputs very detailed charts of your simulations. Here you will learn how to control the visualization of graphs.
All the graphical components are described, the numerous options and the functionalities provided.
Among which: how to select the type of graph, the dimension of the charts, X-axis and Y-axis controls, what to plot,
buy & sell signals, stop loss and take profit levels, intraday signals, scroll alternatives, "Go to" functionality, mouse facilities,
types of segment connections for curves, import and export of indicators, the colors and more.
Open the Charts Window
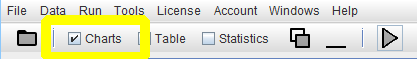 In order to open the charts window, after running at least one simulation, in the main window of Trading Conceiver, select the check box
ChartsEach time you run a simulation, the charts will be updated.
Type
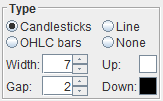 In the type pane, you select how prices are visualized.
Candlesticks
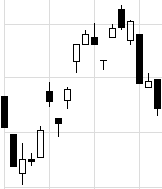 Prices are shown as candlesticks.
 The body (rectangle) is drawn between the open and the close.
The shadows (vertical lines) connect the body with the low and the high.
OHLC Bars
 Prices are shown as Open - High - Low - Close bars.
 The vertical bar is between the low and high.
The left horizontal bar is at open level.
The right horizontal bar is at close level.
Line
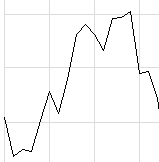 Prices are shown as a line connecting closing prices.
None
Prices are not plotted.Width
The width of each candlestick / ohlc bar.Gap
The gap (blank space) between two adjacent candlesticks / bars.Up
Color for up days.For candlesticks when:
open < closeFor OHLC bars when:
previous close < closeFor lines it is the color of the line, with no distinction between up and down days.
Down
Color for down days.For candlesticks when:
open > closeFor OHLC bars when:
previous close > closeFor lines it is the color of the line, with no distinction between up and down days.
Height
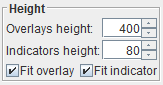
Overlays Height
Height of the overlay graph, i.e. the one containing the price.Indicators Height
Height of each graph containing the indicators.Fit overlay - Fit indicator
These checkboxes fit the overlay and the indicators, respectively, to the height of their chart. If checked, the graph is zoomed in vertically, so that its current range fits the height of the chart. If unchecked, the graph is not zoomed in vertically, so that its entire range corresponds to the height of the chart.X axis
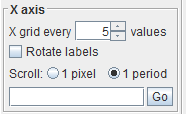
X grid every n values
Number of periods between two adjacent grid lines. The Y grid follows along proportionally. The labels densities along the X and Y axes depend directly on this number.If you don't want to plot the grid, set this number to 0.
Rotate labels
If checked, rotates 90 degrees counter-clockwise the X-axis labels.Scroll
Select the amount to shift along the X axis when pressing the scroll bar left and right buttons:- 1 pixel
- 1 period
1 entry (bar, candle...)
Go To
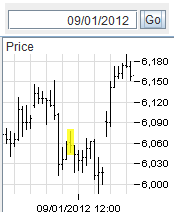 Write a date / time in the text field and press the
 Enter key on the keyboard or the Go button.
The chart will scroll automatically to make the selected date visible and highlighted.
What Is Matched
More precisely, the match is for the first occurrence in the columnDate & Timewhich shows the concatenation of the
date and time fields of the historical file.
In order to have a hit, it is sufficient that the beginning of the string representing the concatenation matches the text in the text-field.
Copy the Date - Bookmark
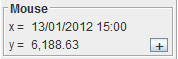
Instead of writing a date, it can be convenient to copy it from the label showing the x position in the paneMouseClick in the chart on the day you are interested in, copy the date from the label and paste it in the
Go text field.
Each time you press the Go button you will return to that point.
This is actually the behavior of a bookmark.
Y axis
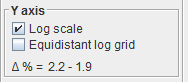
Log scale
If selected, Y-axis values are shown in logarithmic scale.Equidistant log grid
What is equidistant in a linear scale, is not in a logarithmic scale. By checking this box, an equidistant grid will be used with the logarithmic scale. By the properties of logarithm, this way the percentual difference (distance) between two grid lines is constant on a linear scale.Δ %
The price difference in percentage between two adjacent horizontal tick marks (grid-lines). The first number is for the first 2 ticks at the bottom. The second number is for the first 2 ticks at the top. They are computed as:
      upper tick - lower tick
  ────────────────────────────────
  average (upper tick, lower tick)
The first number is greater than the second, unless the check-box 'Equidistant log grid' is selected (for a logarithmic scale).
Buy / Sell Signals
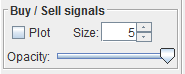
Plot
If checked, buy and sell signals are plotted. They are represented as squares.Size
The size of buy and sell signals in pixels.Opacity
The opacity of buy and sell signals, so that they can be made partially transparent to see what there is beneath.Colors
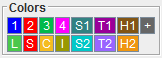 Colors are fully customizable.
Just click on the button whose color you want to change.
Colors are fully customizable.
Just click on the button whose color you want to change.
Matching Hues with the Table
Default settings for some of these colors have matching hues with the corresponding colors in Table; they are slightly different though, because in Table they are used as background, while in Charts they are used as foreground.Opacity / Transparency
 Colors have also the alpha channel.
This means they can be made partly opaque / transparent, so that they don't hide completely what lies beneath.
This could be useful also to hide temporarily an overlay.
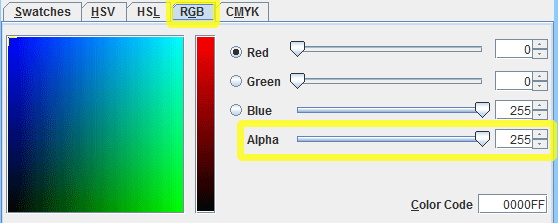
For instance, select the classic RGB tab, and enter a value for the alpha channel.
A value of 255, the default, means the color is completely opaque.
A value of 0 means the color is completely transparent.
Colors have also the alpha channel.
This means they can be made partly opaque / transparent, so that they don't hide completely what lies beneath.
This could be useful also to hide temporarily an overlay.
For instance, select the classic RGB tab, and enter a value for the alpha channel.
A value of 255, the default, means the color is completely opaque.
A value of 0 means the color is completely transparent.
1 / 2 / 3
Color of the first/second/third overlay.Color of the first/second/third value for a multi-value indicator.
4
Color of the fourth overlay.S1 / S2
Color of the first/second stop loss.T1 / T2
Color of the first first/second take profit.H1 / H2
Color of the first/second horizontal level.L
Color for long signals.S
Color for short signals.C
Color for liquidate signals, when the position is closed.I
Color of the indicator imported from a file.+
Color of the cross-hair.Mouse
x
X coordinate where the mouse is clicked or dragged.y
Y coordinate where the mouse is clicked or dragged.+
Clear the cross-hair.Plot

Overlays
Plot the overlays.Stop loss
Plot the stop loss levels.Take profit
Plot the take profit levels.g in f(g(x))
Most indicators are a function composition, where an indicator f is applied to the output of another indicator g, which is written as:f(g(x))In such cases, if this checkbox is selected, both the f and g curves are plotted, which yields the maximum information. If, on the other hand, the checkbox is unselected, only f is plotted and g isn't, which makes the main indicator more prominent. The affected indicators' typologies are:
- MA/EMA of indicator
- Two MAs/EMAs of indicator
- Zig Zag of MA of indicator
- Histogram indicator
Connection
 These settings relate to the way the values of overlays and indicators are connected in order to form their curve.
Overlays and indicators change value abruptly, usually but not necessarily at close, when they are recalculated.
So their real values are only those taken upon calculation. In order to graph a curve, those values are connected in one way or another.
These settings relate to the way the values of overlays and indicators are connected in order to form their curve.
Overlays and indicators change value abruptly, usually but not necessarily at close, when they are recalculated.
So their real values are only those taken upon calculation. In order to graph a curve, those values are connected in one way or another.
Standard
 Adjacent values are connected through a straight line. This is the standard way and very likely the way you are used to.
This is probably the most pleasant to the eye. However, the straight segments show values the indicator never takes,
as if the indicator gradually took intermediate values between those at the extremes.
Adjacent values are connected through a straight line. This is the standard way and very likely the way you are used to.
This is probably the most pleasant to the eye. However, the straight segments show values the indicator never takes,
as if the indicator gradually took intermediate values between those at the extremes.
Step-like
 This is the most accurate way to represent the indicator value, although probably the least pleasant to the eye.
Only the real values taken by the indicator are shown, so each value is represented by a horizontal line, until the next value.
In order to make the curve more readable, a vertical segment is drawn where the transition from one value to another occurs.
This is the most accurate way to represent the indicator value, although probably the least pleasant to the eye.
Only the real values taken by the indicator are shown, so each value is represented by a horizontal line, until the next value.
In order to make the curve more readable, a vertical segment is drawn where the transition from one value to another occurs.
The Value Is the Final One
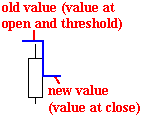 If an indicator changes its value in a certain instant in time, by the way it is drawn in the step-like fashion,
it looks as if there are two possible values, the old and the new one, in the same instant in time.
As said, they are connected through a vertical segment, meaning the change is instantaneous.
The real value to consider in that instant in time is the new one, i.e. the final one for that instant in time.
This way, it is clear exactly from when the signal can be used, without being predictive.
If an indicator changes its value in a certain instant in time, by the way it is drawn in the step-like fashion,
it looks as if there are two possible values, the old and the new one, in the same instant in time.
As said, they are connected through a vertical segment, meaning the change is instantaneous.
The real value to consider in that instant in time is the new one, i.e. the final one for that instant in time.
This way, it is clear exactly from when the signal can be used, without being predictive.
In the example, the indicator changes its value at close, and at close the value to consider for the indicator is the new one, not the old one.
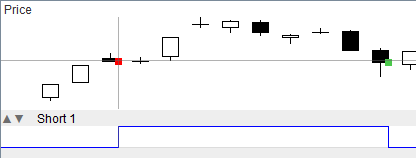 For instance this holds true for indicators in the
 'Trading algorithms' branch, indicating the trading signals given by the Long, Short... tabs.
In the example, at close there is a short signal given by the trading algorithm and, indeed, a short position is opened.
That's because at close 'Short 1' is to be considered true, not false.
The other way around holds true when opening a long position.
Example: when they are important
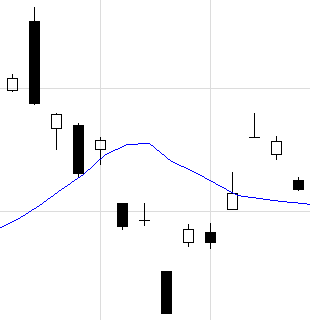
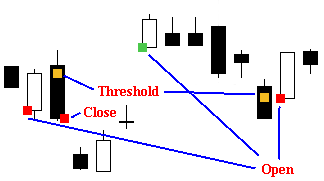
The difference between these methods is particularly important when evaluating breakouts. As an example, let us consider the Donchian breakout, where there is a long signal if the price goes above the Donchian channel upper line and a short signal if the price goes below the Donchian channel lower line.Standard Connection
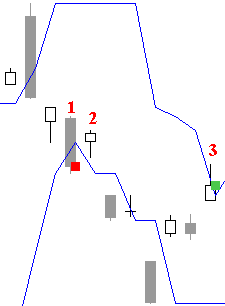 Using the standard connection, we can not always make a right comparison between the price and the overlay.
In this example, we could erroneously conclude that the breakout happened at Threshold on day 1, and yet there is no short signal at Threshold.
On the contrary, on day 2 there seems to be no breakout.
Analogously, on day 3 there seems to be a breakout at Threshold, and yet the long signal is at close.
Using the standard connection, we can not always make a right comparison between the price and the overlay.
In this example, we could erroneously conclude that the breakout happened at Threshold on day 1, and yet there is no short signal at Threshold.
On the contrary, on day 2 there seems to be no breakout.
Analogously, on day 3 there seems to be a breakout at Threshold, and yet the long signal is at close.
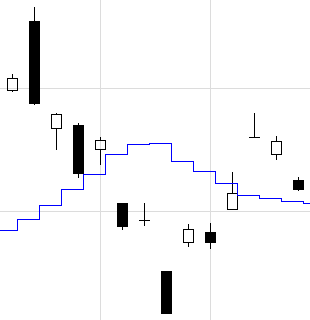
Step-like Connection
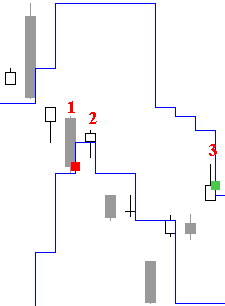 Using the step-like connection, we now can see that on days 1 and 3 no breakout occurs at Threshold, while a breakout does happen on day 2.
As explained earlier, at close the right value to look for the indicator, is the final one.
That's why on days 1 and 3 there are trading signals: a breakout occurs.
So the signals given by Trading Conceiver are correct.
Using the step-like connection, we now can see that on days 1 and 3 no breakout occurs at Threshold, while a breakout does happen on day 2.
As explained earlier, at close the right value to look for the indicator, is the final one.
That's why on days 1 and 3 there are trading signals: a breakout occurs.
So the signals given by Trading Conceiver are correct.
Reset
Resets all controls to their default value.Toggle indicators' visibility
By clicking on an indicator's header, you can toggle its visibility. The indicator is collapsed or expanded each time you click on the header.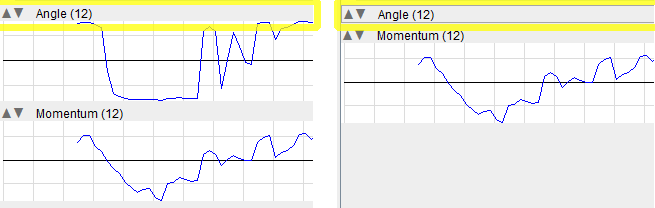
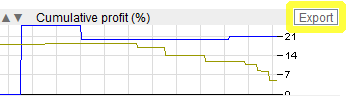
Export
 The
The Export button allows you to export an indicator to a file.
By clicking on it you will be asked for a file where to export the output of the indicator.
Only the first curve
Only the first curve of the indicator is exported. So, if the indicator is multi-valued, only the first series is saved to file. The first series is the most important, the core of the indicator, and is the one represented with color 1.Import and usage
You can then import the file for the purpose of comparing two curves in the same graph. With this technique you can for instance compare the same indicator for two different trading systems, two different simulation runs. As an example you might want to compare the "Cumulative profit (%)" indicator for two different trading systems to spot where one fares better than the other.More information
The import operation is executed in the Indicators tab of the main window; see the relevant page for more information and a usage example.Cross-hair
In order to make a cross-hair appear, press a mouse button and keep it pressed for a while without dragging it. From the moment it appears, you can drag it.Expand / Collapse Controls
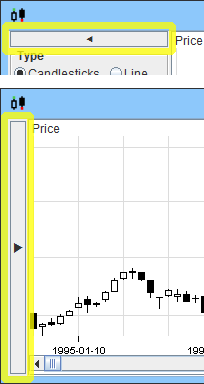 You can collapse the control pane to reduce its footprint by pressing the left arrow button on top of the control pane.
Once collapsed, you can expand it again by pressing the right arrow button on the left of the window.
You can collapse the control pane to reduce its footprint by pressing the left arrow button on top of the control pane.
Once collapsed, you can expand it again by pressing the right arrow button on the left of the window.
Intraday
Intraday Signals
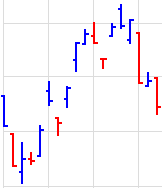
In general, overlays, indicators, signals... are all drawn taking into account the intraday instant, i.e. open, intraday or close. For instance, the buy / sell signals might appear as in this example, where the particular instant within the day when the signal occurs is apparent. Specifically:- Left ≡ Open
If the signal is drawn on the left of the candle, it means it occurred at open. - Right ≡ Close
If the signal is drawn on the right of the candle, it means it occurred at close. - Center ≡ Threshold (Intraday)
If the signal is drawn horizontally in the middle of the candle, it means it occurred intradaily, i.e. in an instant in time between open and close. The vertical level at which it is drawn, corresponds to the threshold level the trade occurred.