Table
Trading Conceiver outputs a very detailed table of your simulations. Here you will learn table settings.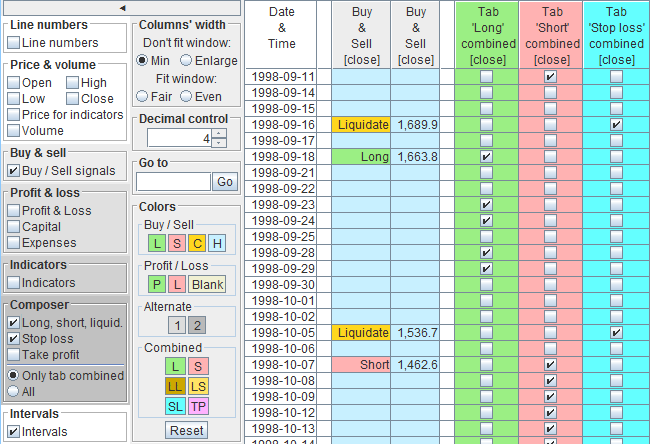
Open the Table Window
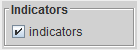
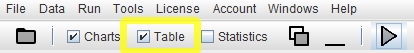 In order to open the table, in the main window of Trading Conceiver, select the check box
TableEach time you run a simulation, the table will be updated.
Date and Time
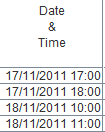 Date and time are always shown; there are no graphical components controlling it.
What is shown is the concatenation of the
Date and time are always shown; there are no graphical components controlling it.
What is shown is the concatenation of the date and time fields of the historical file.
Line Numbers
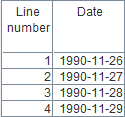
 Show the progressive line number.
Price & Volume
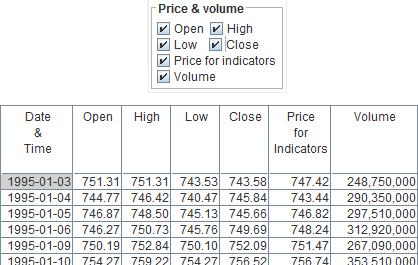
Open
Show the open price.High
Show the high price.Low
Show the low price.Close
Show the close price.Price for indicators
Show the price used to calculate the indicators, as selected in theIndicators tab, by the radio buttons
For price use
Volume
Show the volume.Buy & Sell
 Show the buy and sell signals.
Colors
 The colors of the background are determined by the correspondent choice in the
 Colors section.
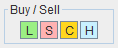
You can select the colors for the signals
  Long
  Short
  Liquidate (Close position)
  Hold
Default colors have matching hues with the corresponding colors in Charts; they are slightly different though, because in Table they are used as background, while in Charts they are used as foreground.
Buy / Sell signals
Only at close / open
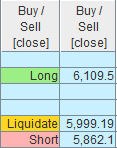 Two columns are shown, the first with the signal (Long, Short, Liquidate) and the second with the price the signal should take place at.
Intraday
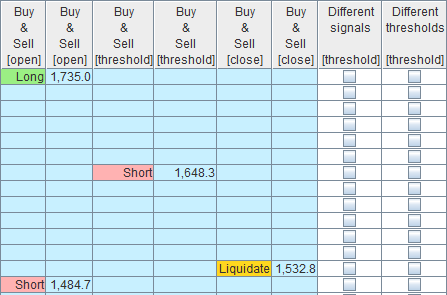 As above, but the pair of columns is shown for open, threshold and close.
Moreover, the columns
'Different signals' and 'Different thresholds' are displayed.
For their meaning, refer to the 'Building a Trading System' section of the manual.
Profit & Loss
 Show profit & loss.
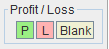
Colors
The colors of the background are determined by the correspondent choice in theColors section.
You can select the colors for Profit (positive gain), Loss (negative gain) and for blank cells.
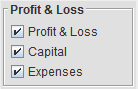
Profit & Loss
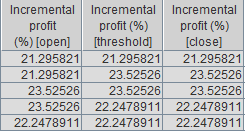
Show the profit and loss as a percentage.Only at close / open
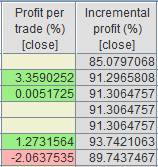 Two columns are shown, one with the profit per trade and the other with the incremental profit.
Intraday
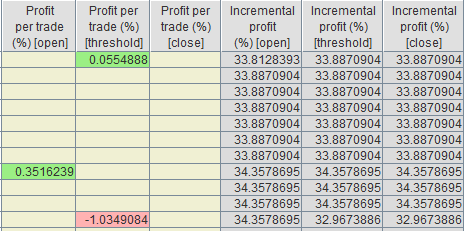 As above, but the pair of columns is shown for open, threshold and close.
Capital
Show the capital (balance) in terms of currency.Only at close / open
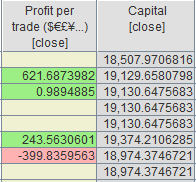 Two columns are shown, one with the profit per trade and the other with the capital.
Intraday
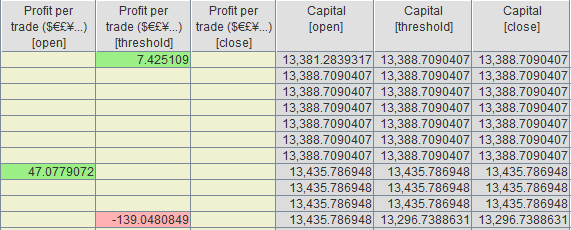 As above, but the pair of columns is shown for open, threshold and close.
Expenses
Show the expenses.Only at close / open
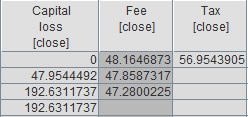 Three columns are shown, one with the capital loss, another with the brokerage fees (the sum of fixed and percentage fees), and a final one with the capital gain tax.
Intraday
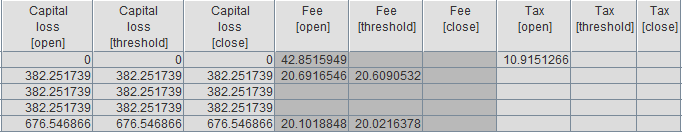 As above, but the three columns are shown for open, threshold and close.
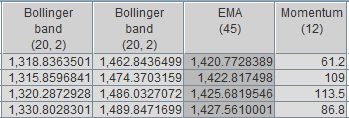
Indicators
 Show the overlays and the indicators.
Indicators
Only at close / open
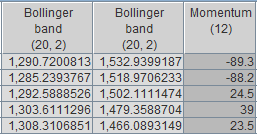 The number of columns depends on the overlay / indicator. Many indicators output just one series, so there is one column.
Indicators like channels or bands output two series, the lower and upper lines, so there are two columns.
A few indicators output three series, consequently there are three columns.
To know what each column of a multi-value indicator contains, hover the mouse over the header and look at the
The number of columns depends on the overlay / indicator. Many indicators output just one series, so there is one column.
Indicators like channels or bands output two series, the lower and upper lines, so there are two columns.
A few indicators output three series, consequently there are three columns.
To know what each column of a multi-value indicator contains, hover the mouse over the header and look at the 'Output series' section of the tooltip.
All values are referred to close or open.
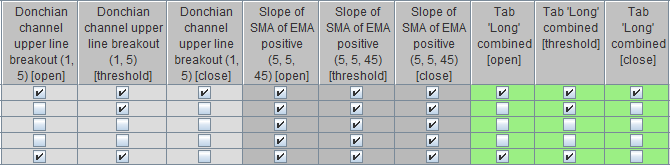
Intraday
 All intraday indicators output just one series, and this series is shown for open, threshold and close, so there are three columns.
Composer
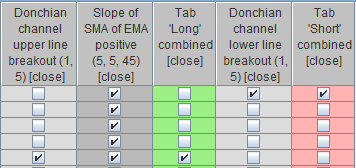
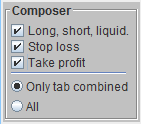 Show the trading algorithms. They are rendered as a check-box, selected if the trading algorithm is true, deselected if the trading algorithm is false.
Only tab combined / All
Tab Combined
The tabs we are referring to are those in the Composer window, namely the Long, Short, Liquidate long, Liquidate short, Stop loss, Take profit. The tab combined algorithm is the one obtained by logically combining all the trading algorithms of a tab. Each non empty tab has a combined trading algorithm.The Two Options
For all the tabs there are two options:- Only tab combined
Shows just the tab combined algorithm. - All
Shows all the trading algorithms in the tab plus the tab combined.
Colors
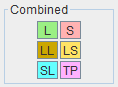 The colors of the background are determined by the correspondent choice in the
 Colors section.
You can select the colors for the columns showing the tab combined trading algorithm.
Default colors have matching hues with the corresponding colors in Charts; they are slightly different though, because in Table they are used as background,
while in Charts they are used as foreground.
Long, short, Liquid.
Show the trading algorithms for the following tabs: Long, Short, Liquidate long, Liquidate short.Only at close / open - Only tab combined
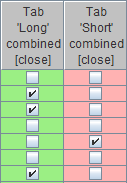 One column per tab is shown. Each column shows one tab combined algorithm. Only the value at close or open is reported.
Only at close / open - All
 For each tab, all the trading algorithms of the tab are shown first and then the tab combined algorithm. Only the value at close or open is reported.
Intraday - Only tab combined
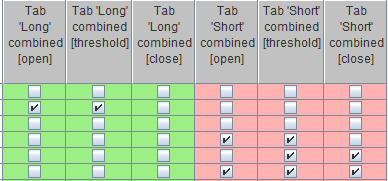 As above, but the values are shown for open, threshold and close.
Intraday - All
 As above, but the values are shown for open, threshold and close.
Stop Loss
Show the stop loss, i.e. the Stop loss tab.Only at close / open - Only tab combined
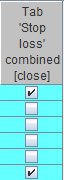 Just one column is shown, the one representing the tab combined algorithm. Only the value at close or open is reported.
Only at close / open - All
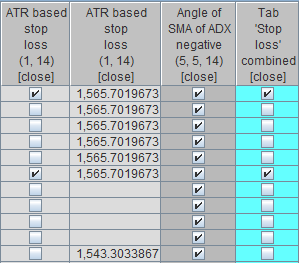 All the trading algorithms of the tab are shown first and then the tab combined algorithm.
In the Stop loss tab, there are two sub-panes: Stop Loss and Trading Systems.
For each of the real stop loss algorithm, i.e. the ones in the Stop Loss pane, two columns are reported, one with the true / false indication, as usual,
and another with the stop loss level. For the algorithms in the Trading Systems pane, on the contrary, only the true / false indication is present.
Only the value at close or open is reported.
All the trading algorithms of the tab are shown first and then the tab combined algorithm.
In the Stop loss tab, there are two sub-panes: Stop Loss and Trading Systems.
For each of the real stop loss algorithm, i.e. the ones in the Stop Loss pane, two columns are reported, one with the true / false indication, as usual,
and another with the stop loss level. For the algorithms in the Trading Systems pane, on the contrary, only the true / false indication is present.
Only the value at close or open is reported.
Intraday - Only tab combined
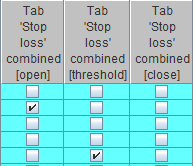 As above, but the values are shown for open, threshold and close.
Intraday - All
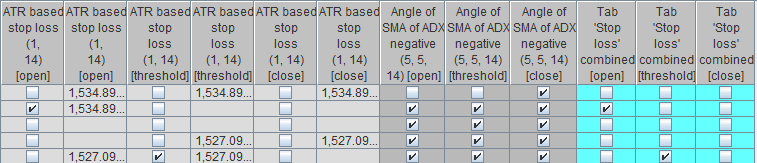 As above, but the values are shown for open, threshold and close.
Take profit
Just as the stop loss, but related to the Take profit tab.Intervals
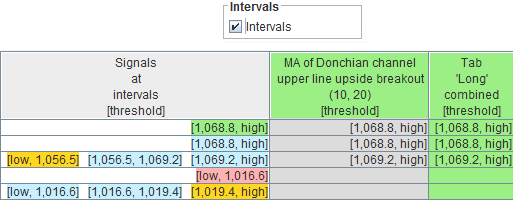 When this checkbox is selected, intervals are shown.
For an elementary trading algorithm and for the algorithms resulting from the tab combinations, intervals show where the algorithm is true at Threshold.
The
When this checkbox is selected, intervals are shown.
For an elementary trading algorithm and for the algorithms resulting from the tab combinations, intervals show where the algorithm is true at Threshold.
The 'Signals at intervals' column details the signals in trading sub-intervals.
Columns' Width
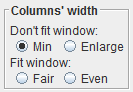 Select how the column width is adjusted.
Minimum
Resizes the columns to the minimum width necessary to fit the data and the header.The resulting table has a width unrelated to the window's horizontal size.
The horizontal scroll bar appears if necessary.
Enlarge
Resizes the columns to the greatest width between the current width (possibly after user's manual resizing) and the minimum width necessary to fit the data and the header.The resulting table has a width unrelated to the window's horizontal size.
The horizontal scroll bar appears if necessary.
Fair
Resizes all columns proportionally to the minimum width necessary to fit the data and the header.The resulting table has a width fitting the window's horizontal size.
The horizontal scroll bar never appears.
Even
Resizes all the columns to the same width, except those used as dividers for improved readability, which are empty.The resulting table has a width fitting the window's horizontal size.
The horizontal scroll bar never appears.
Decimal Control
Here you can control the number of decimal digits to display. This is just for display; internally the maximum available number of decimal digits is always used. Such a number for display depends on two things:- The value input in this spinner.
- The order of the magnitude of the number to display.
Example
Value input in the spinner = 4.| Number to display | Displayed |
|---|---|
| 123,456.7890123456 | 123,456 |
| 12,345.67890123456 | 12,345 |
| 1,234.567890123456 | 1,234.5 |
| 123.4567890123456 | 123.45 |
| 12.34567890123456 | 12.345 |
| 1.234567890123456 | 1.2345 |
| 0.1234567890123456 | 0.12345 |
| 0.01234567890123456 | 0.012345 |
To Not Control the Number of Decimal Digits
If you don't want to control the number of decimal digits, select theDon't useentry in the spinner. In this case, the number of decimal digits displayed will depend on how many of them are actually used internally for calculation and the maximum number of significant digits allowed by internal number format.
Go To
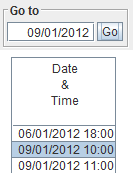 Write a date / time in the text field and press the
 Enter key on the keyboard or the Go button.
The table will scroll automatically to make the selected date visible and selected.
What Is Matched
More precisely, the match is for the first occurrence in the columnDate & Timewhich shows the concatenation of the
date and time fields of the historical file.
In order to have a hit, it is sufficient that the beginning of the string representing the concatenation matches the text in the text-field.
Colors
See also the previous sections.Alternate
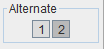 In order to make the table more readable, two background colors alternate between columns' values to make more apparent how they are associated
or separated from each other.
In order to make the table more readable, two background colors alternate between columns' values to make more apparent how they are associated
or separated from each other.
Reset button
Reset colors to their default value.
Panes and Headers
 The background colors of the control panes (on the left side) match those of the relative column headers. They are shades of grey.
For instance, the
The background colors of the control panes (on the left side) match those of the relative column headers. They are shades of grey.
For instance, the Indicators pane background color in the controls, matches the column headers of all columns representing indicators.
Expand / Collapse Controls
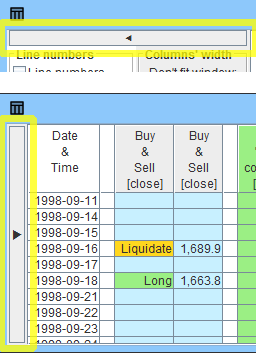 You can collapse the control pane to reduce its footprint by pressing the left arrow button on top of the control pane.
Once collapsed, you can expand it again by pressing the right arrow button on the left of the window.
You can collapse the control pane to reduce its footprint by pressing the left arrow button on top of the control pane.
Once collapsed, you can expand it again by pressing the right arrow button on the left of the window.
Miscellaneous
Highlighted date
 Each trading algorithm has a certain number of periods at the beginning where it is unknown due to the lookback of the indicators it is based upon.
The highlighted date indicates the first date when all trading algorithms are known and so their composition can take place.
Each trading algorithm has a certain number of periods at the beginning where it is unknown due to the lookback of the indicators it is based upon.
The highlighted date indicates the first date when all trading algorithms are known and so their composition can take place.