Quick Start
Learn how to easily exploit indicators in Trading Conceiver.

1. Use the Same Indicators for Table and Charts
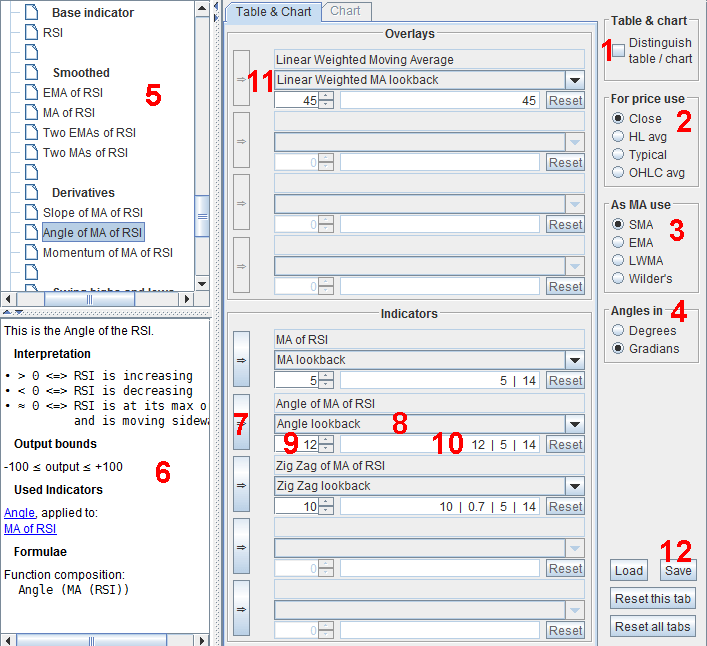
First off, make sure the checkbox
Distinguish table / chart
is unselected. This way you need to select indicators only once, and they will be shown both in the table and in the chart.
2. Use the Close Price
In the pane
For price use
select the radio button
Close
This way you use the usual definition for indicators, the standard formula found in literature.
3. Use the Simple Moving Average
In the pane
As MA use
select the radio button
SMA
This way you use a simple moving average to smooth indicators.
4. Use the Gradians
In the pane
Angles in
select the radio button
Gradians
This way the units of measure for angles are in gradians, similarly to the decimal system we are used to.
5. Select the Indicator
 Select an indicator in the Tree, from the
Indicators
branch, where all indicators are listed.
Indicators are charted in a graph separate from the price.
6. Look at the Description
Take a look at the description, to review its fundamental characteristics.
7. Insert the Indicator in One Slot
Press one of the Select buttons in the Indicators pane to actually put the selected indicator in the correspondent slot.
8. Select a Parameter to Change It
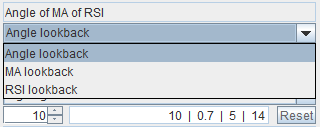
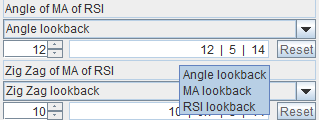
 Through the combobox, select one of the input parameters in order to change its value from its default one.
9. Set the Parameter Value
Through the spinner, select the value of your choice for the input parameter.
10. Check the Parameters
 Check the input parameters values in the text field.
11. Repeat for the Overlays
 Repeat steps 5 to 10 for the overlays.
Overlays are charted in the same graph as the price and are listed in the
Overlays
branch of the Tree. This time, at step 7, you will have to press one of the Select buttons in the Overlays pane.
12. Save the Configuration
Press the Save button to save this configuration.
You can recall it later on by pressing the Load button.
13. Select Charts and Table
 In the main tool-bar, select the checkboxes
  Charts
  Table
This way both the charts and the table will be shown each time you run the simulation.
14. Run the Simulation
Press the Run icon to run the computation.

 Select an indicator in the Tree, from the
 Through the combobox, select one of the input parameters in order to change its value from its default one.
 Check the input parameters values in the text field.
 Repeat steps 5 to 10 for the overlays.
Overlays are charted in the same graph as the price and are listed in the
 In the main tool-bar, select the checkboxes
