In Charts and Tables
This chapter describes how to watch the tab combination in charts and tables.Refer also to the chapter about the algorithms based on technical indicators. Here just the peculiarities about the tab combination is pointed out.
In Charts
Through the Dedicated Indicators
 You can see when the combination of the tabs is true or false in Charts.
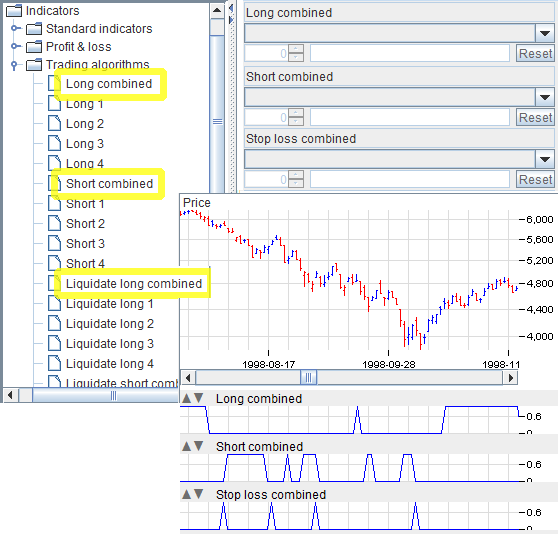
In the Indicators tab, expand the
You can see when the combination of the tabs is true or false in Charts.
In the Indicators tab, expand the
Trading Algorithmsbranch and select the indicator corresponding to the tab you are interested in. Their names are of the form:
Tab name combinedFor instance:
Liquidate short combined
In Tables
Show the Data
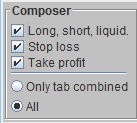 In order to watch the algorithm resulting from the combination of the tabs, in the Table window you must select the following checkboxes:
- Long, short, liquid.
For the tabs:Long, Short, Liquidate long, Liquidate short. - Stop loss
For theStop losstab. - Take profit
For theTake profittab.
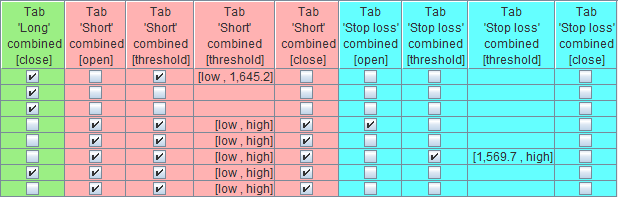
  Only tab combined
  All
The column header reports the wording
'combined' in it; for instance:
Tab 'stop loss' combined