Debugger
Learn how to launch the Debugger in case of problems / errors / bugs.
The Debugger is a tool to collect useful, low-level information in case of errors.
You can then send that information to us so that we can fix the bugs.
Here we describe how to launch the Debugger and what to do with the report it generates.

What It Is
All software has bugs, and Trading Conceiver makes no exception. In case you run into errors / problems / bugs with Trading Conceiver, you can collect some useful information that we can use to understand and solve the problem.It Is Important to Us
Solving the application's bugs is one of our priorities, because we like to think we are offering a useful and powerful application. Such an application must also be reliable. So we passionately invite you to report bugs as soon as you stumble into one. And we thank you in advance for doing that.Steps to Take
In order to use the Debugger, first thing close all currently opened instances of Trading Conceiver.Now you can launch the Debugger. The Debugger is launched like any other application. In the TradingConceiver category of Windows applications, select
ConceiverDebuggerOr search for it through the Windows search feature.
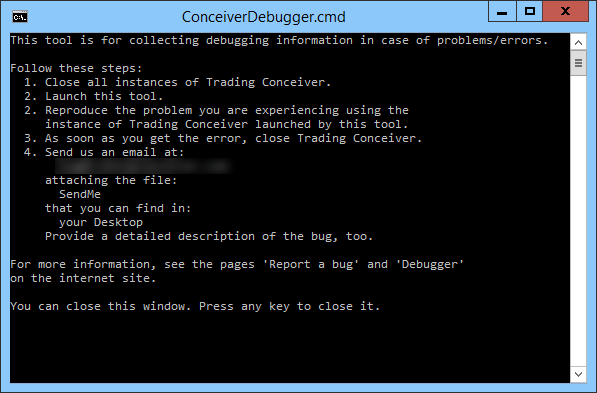
The Debugger will open a console window.
The Debugger will also launch an instance of Trading Conceiver. Use this instance to reproduce the problem / error / bug you are experiencing.
As soon as you get the error, close Trading Conceiver.
You can close the console window any time after it launches Trading Conceiver. Just press any key to close it, or click the usual window frame's 'X' button .
The Report
The Debugger generates a report file, which we can use to identify and correct the issue. The file is namedSendMe
Where It Is
The position / directory where to find the file is indicated in the console window.The default position of the file is the Desktop.
If the Desktop position can't be determined, it will be saved in the user's home directory, usually:
C:\Users\<user name>
If even this location can't be determined, the console will ask you to indicate yourself the directory where to store the file. For instance, you could input:
C:\MyDir
